Traffic Intelligence
Human vs bot visit and event behaviour across packages, geographies, devices and UTM parameters.
Total visits
8,267
438 events recorded (5.3% of visits)
Human share
45.8%
3,790 visits · 346 events
Bot share
54.2%
4,477 visits · 92 events
Quality multiplier
8.3x
Human traffic converts 8.3x better than bots — 2.98% vs 0.36%
Human · High intent
15.0%
1,236 visits · 255 events
Human · Low intent
30.9%
2,554 visits · 91 events
Bots
34.1%
2,820 visits · 15 events
Declared · Good bots
2.9%
238 visits · 1 events
Declared · AI agents
2.1%
176 visits · 1 events
Bot · Suspicious
15.0%
1,243 visits · 75 events
Daily traffic trend
Visits and events per day, split across the five traffic classes
Human vs bot traffic distribution
Where human and bot visits sit across each breakdown — open a row for how that traffic behaves
India holds 29.7% of all bot visits in this view, and 53.6% of its own traffic is bot — against 30.4% of all human visits.
Human · High intentHuman · Low intentBotsDeclared · Good botsDeclared · AI agentsBot · Suspicious
| Country | visits | Mix within row (human vs bot) | % of all human visits | % of all bot visits | |
|---|---|---|---|---|---|
| India | 2,485 | 53.6% bot | 30.4% · 1,154 | 29.7% · 1,331 | |
| Brazil | 1,678 | 55.9% bot | 19.5% · 740 | 21.0% · 938 | |
| United States | 1,647 | 52.0% bot | 20.9% · 791 | 19.1% · 856 | |
| Vietnam | 859 | 57.2% bot | 9.7% · 368 | 11.0% · 491 | |
| United Kingdom | 560 | 56.4% bot | 6.4% · 244 | 7.1% · 316 | |
| Germany | 532 | 52.8% bot | 6.6% · 251 | 6.3% · 281 | |
| Spain | 506 | 52.2% bot | 6.4% · 242 | 5.9% · 264 |
Behaviour heatmap · real mfilterit pages
Click density captured on the live page. Humans scatter across nav, hero, solution cards, insights and FAQ; bots collapse onto two or three CTAs and barely touch anything else.
mfilterit.com/Scroll the page to inspect click density
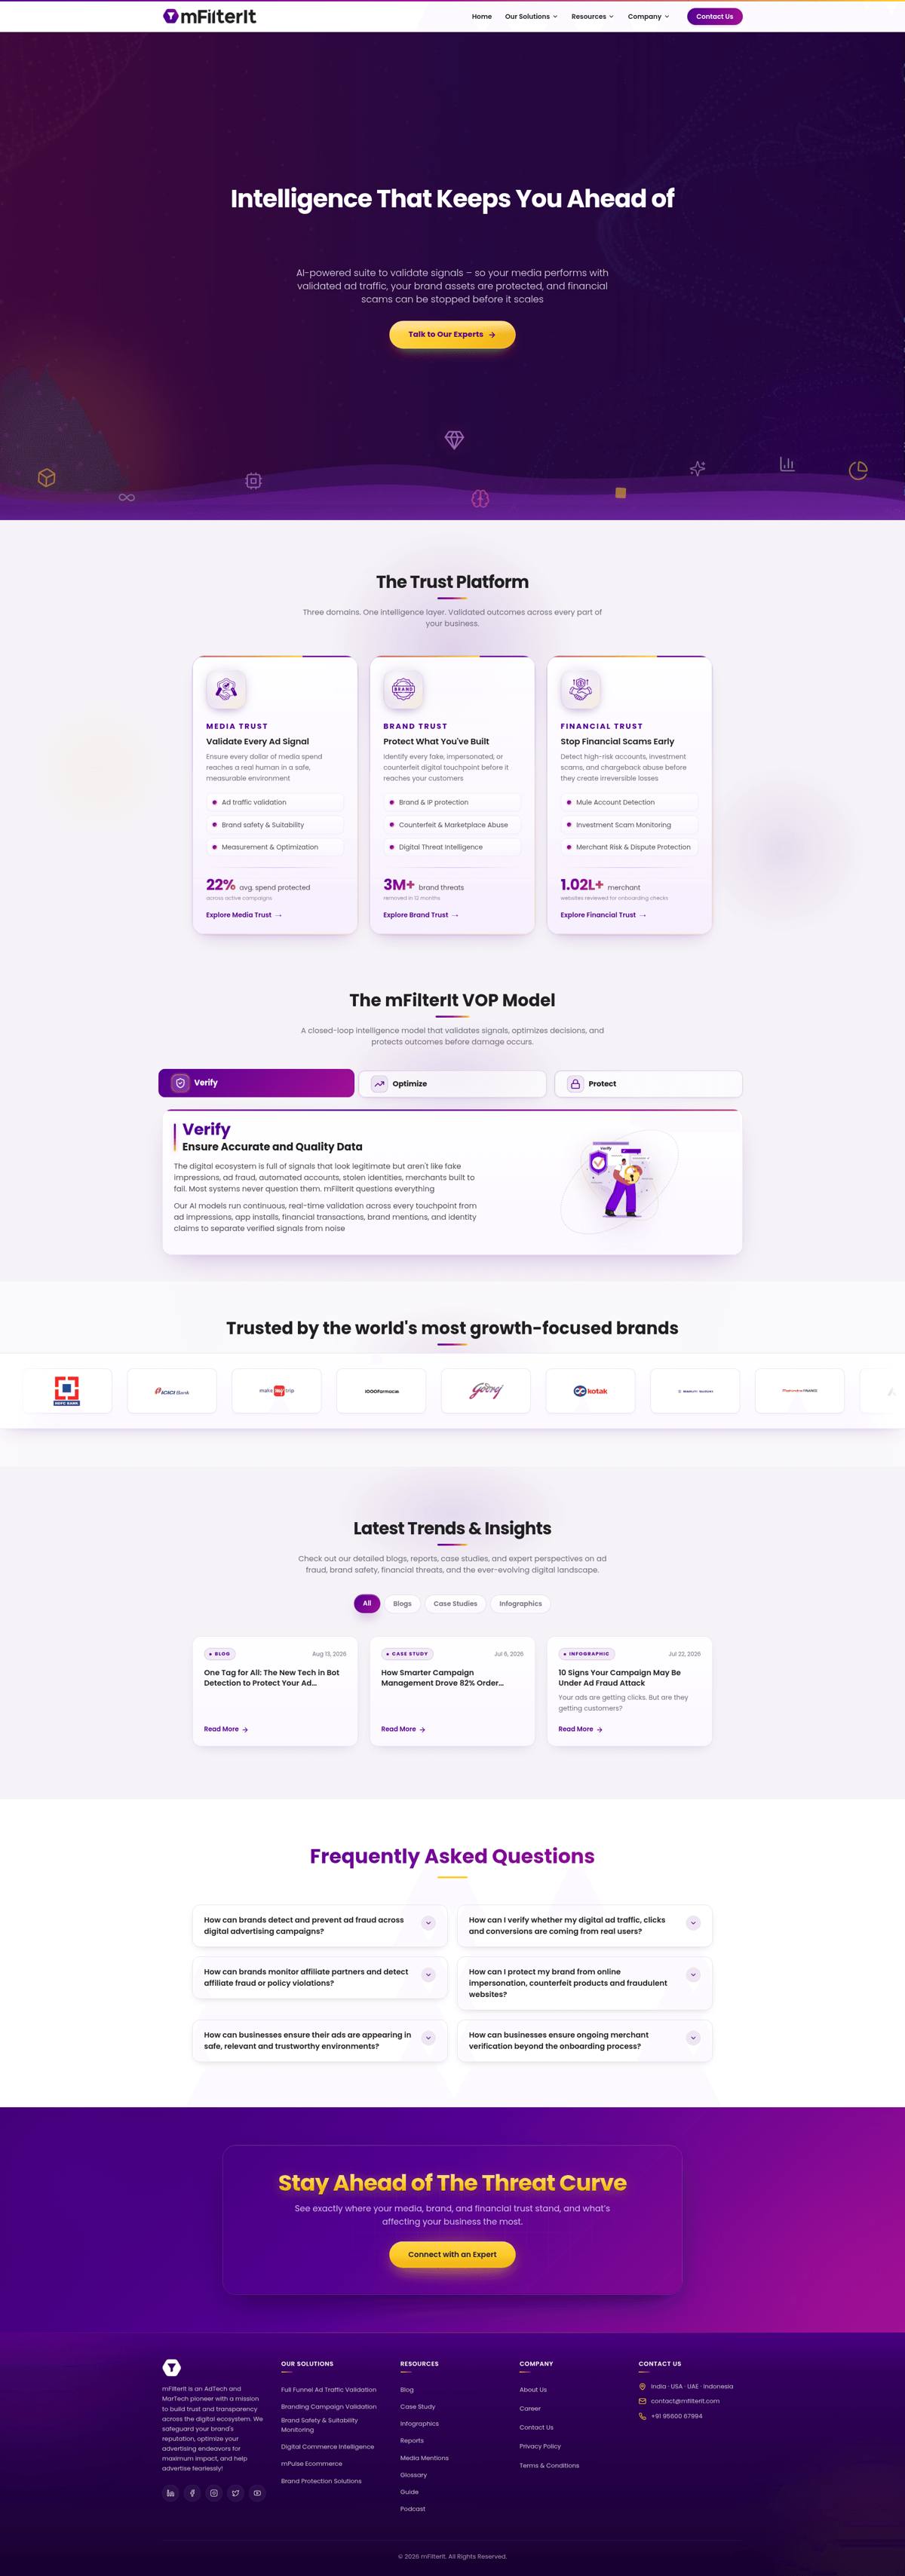
Hover a section on the page
Pick any section below to jump to it on the page and see human vs bot click share, click latency and the most common next page.
Sections by click share
Top bar = human share, bottom bar = bot share of that group's clicks.
Scroll-depth distribution
% of visits
Dwell-time distribution
% of visits